

On cohort progression and spending per student in Bellevue School District

I've heard from a few folks that they've seen the enrollment declines in Bellevue are skewed heavily towards earlier grades. I dove in to see if I could detect and then illustrate this trend.
I also took a look at our budgets going back to 2015 to see how spending per student has trended, and how it would look if spending growth tracked CPI.
Visualizing cohort progression
The enrollment data provided by the state has a lot of subcategories. Grade, race, gender, income, military status, etc. are all there for us to analyze. I organized this state data to show me how grade cohorts in Bellevue changed from year to year.
Here’s about the best stock chart I could coax out of Excel from that data:
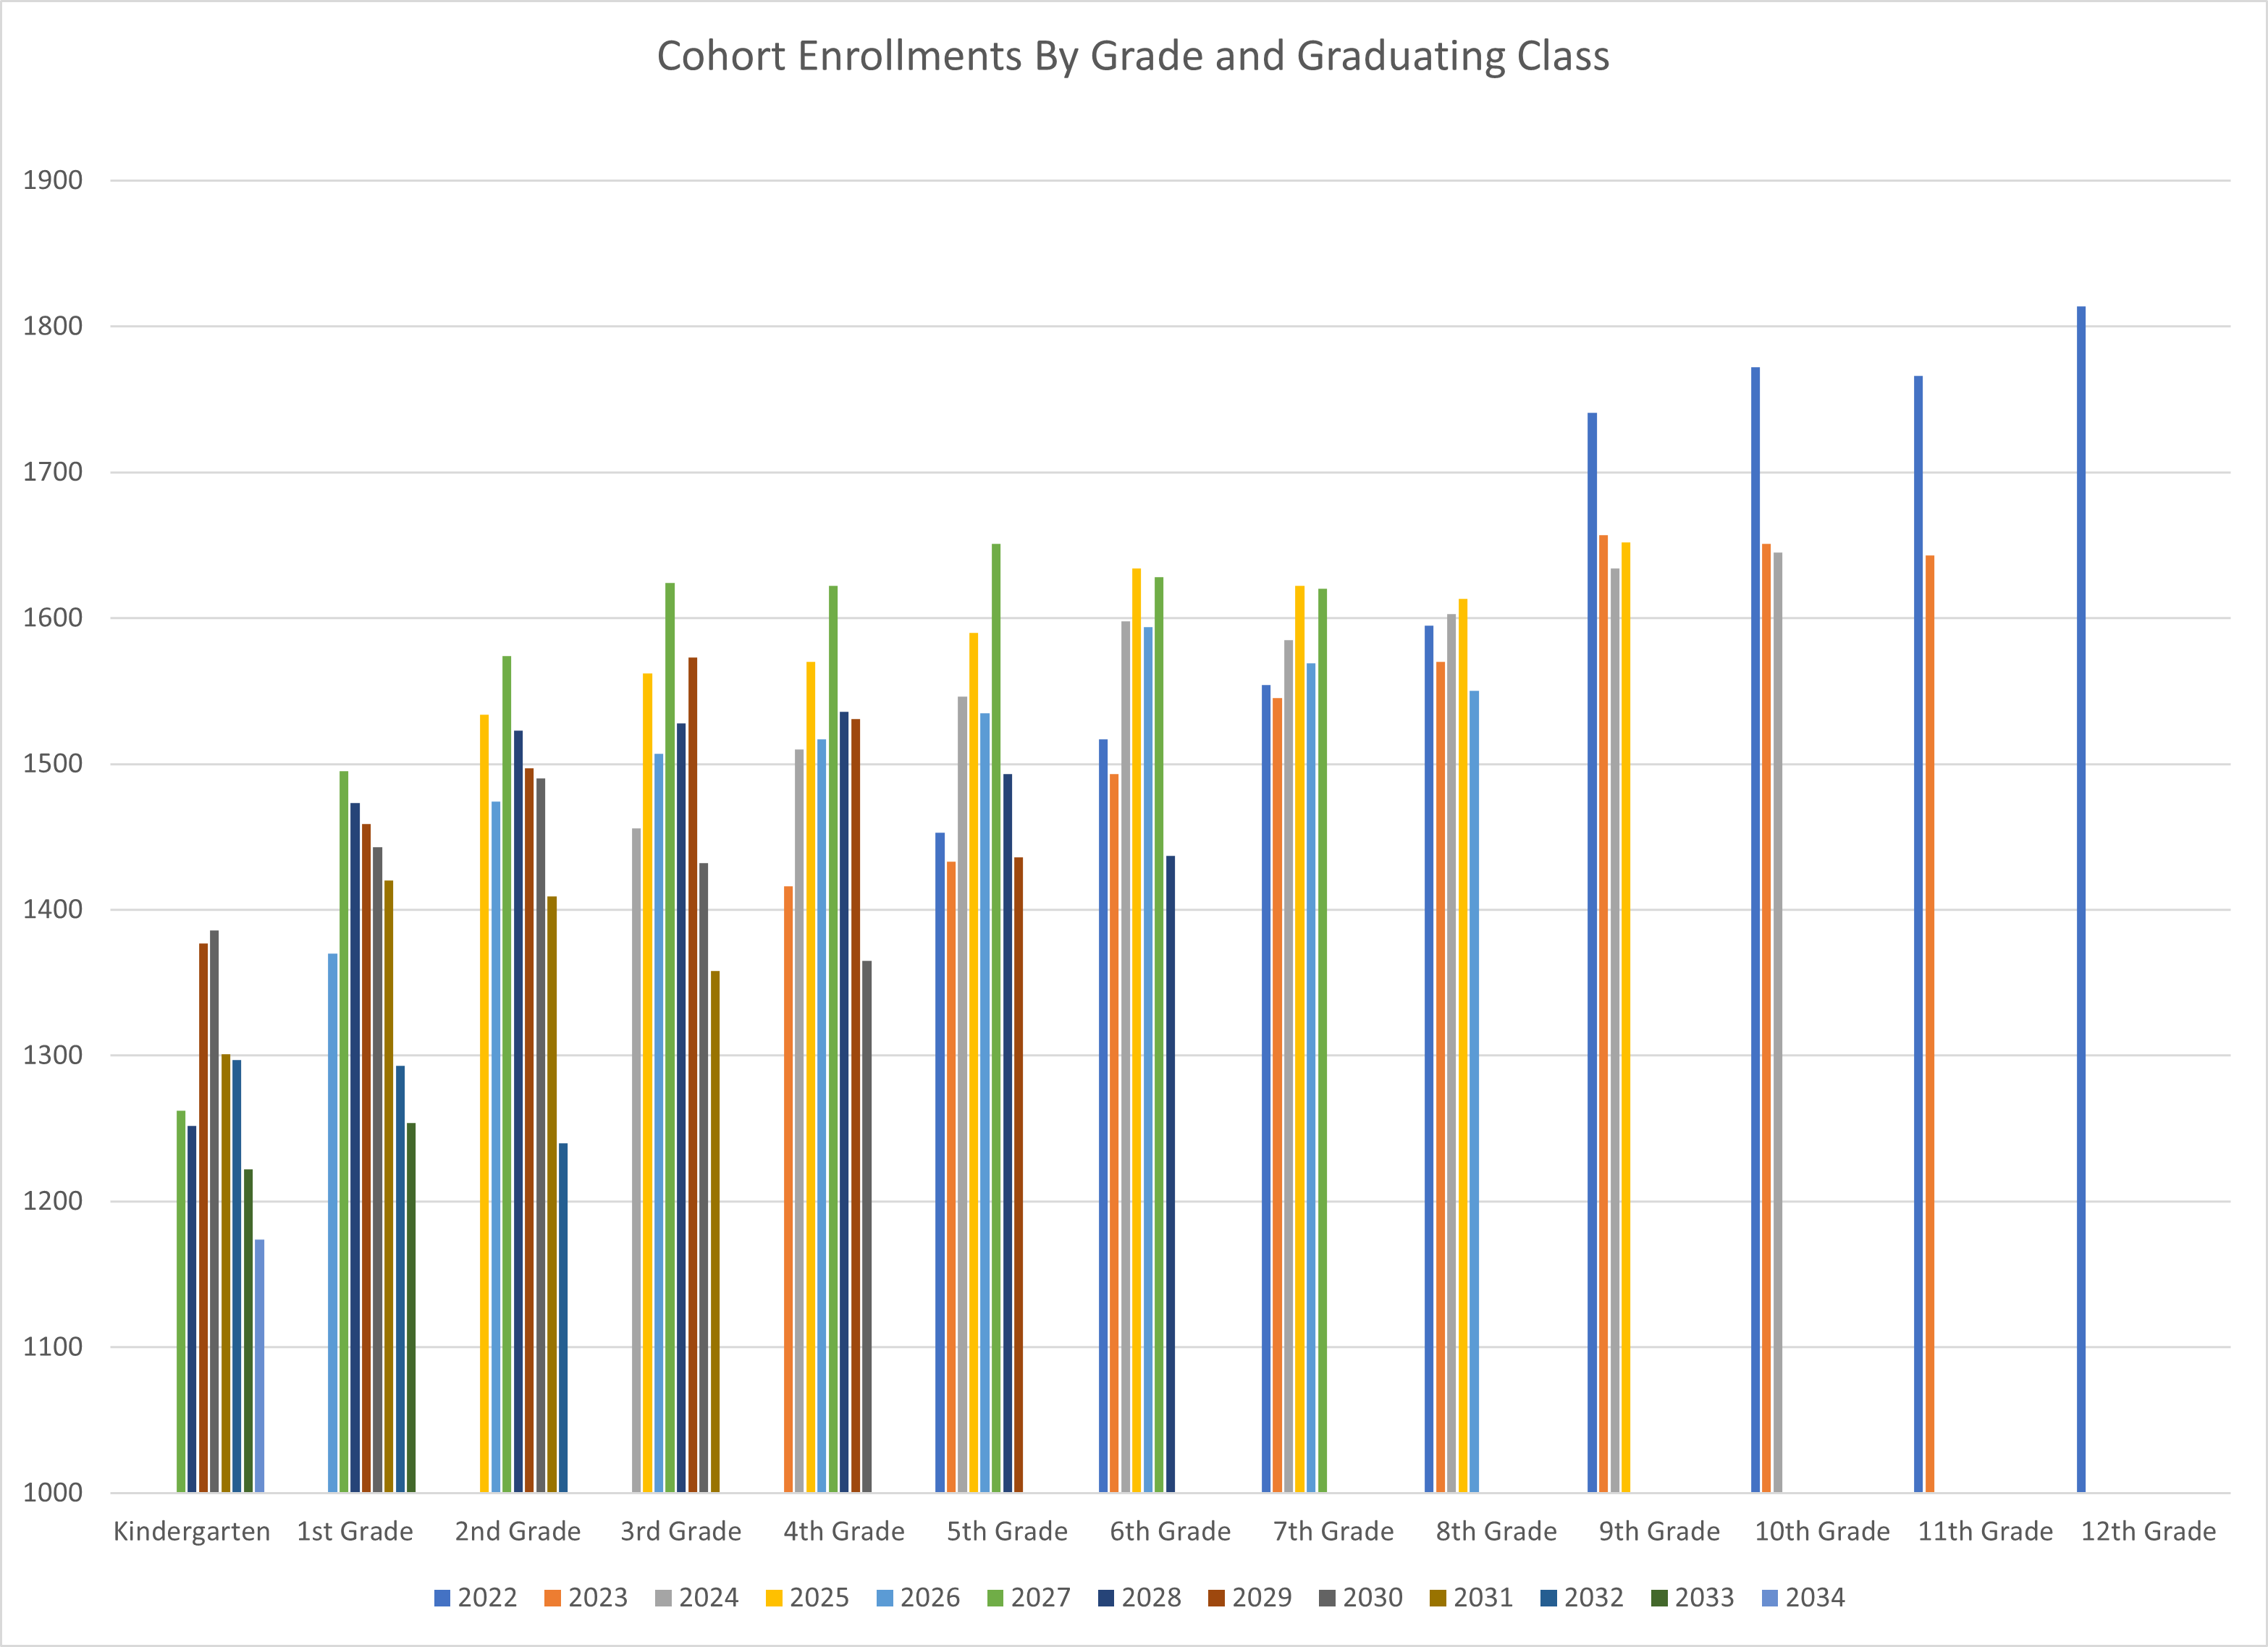
You can kind of see the progression through the grades, but it’s pretty crowded and hard to focus on a single color to see how it changes over time.
Excel could also produce a line chart, but all the lines were overlapping, so it was also hard to see the cross-cohort trends as well as the individual cohorts. I decided to do some image editing to make it easier to see all the cohorts and came up with this:

The vertical axis in this visualization doesn’t indicate any value, instead what I’ve done is taken the line for each cohort and stacked them with the oldest kids at the bottom. A line being higher than another doesn’t mean it has more students, it means it has a younger grade cohort.
All the lines are unscaled from their originals, and only moved vertically. They still line up with the right grades, and you can compare the relative changes.
I also added some shading to indicate which years had data from before the pandemic.
Most of the high schoolers actually increased enrollment, with their cohorts at their highest enrollment since 2014, which is the start of the dataset I’m working with.
The cohorts that were in 7th and 8th grade in the 2021-22 school year had a modest drop, they lost about three years of growth.
The elementary enrollment had steep growth pre-pandemic and then fell off a cliff after.
You might notice that growth is super steep going from kindergarten to first grade. I thought this might be an artifact of half-day kindergarten, which is broken out as its own grade. It could have been a factor for the classes of 2027 and 2028, those years had 132 and 83 students enrolled. Following those years the data has single digit numbers of kids in half-day kindergarten.
Spending per student
I was also curious about how spending has changed over time, specifically in terms of how much we spend for each student enrolled in the district. My interest in this was piqued by the district’s presentation yesterday. We were told that the state had been funding school districts at pre-pandemic levels of enrollment, but starting this fall would no longer be doing that. This drop in funding was one of the reasons the district is looking to consolidate schools.
I pulled both enrollment data and total expenditures from the district’s F-195 budgets. Where available I used the actual spend reported on prior years. This was not available for the latest two years, 2020-21 and 2021-22, so I used the budgeted values. The earliest year available was 2015.
I was also curious about how our spending growth compared to inflation. I pulled yearly average CPI values from the Minneapolis Federal Reserve and used those to calculate what the 2015 budget would be if it grew at the pace of inflation.
Here’s what that looks like:

We greatly outpaced inflation.
Rewinding back to the 2020 level of spending per student, when the district had more than a thousand more students than it has now, would have saved about $56 million in the 2022-23 budget.
At last night’s open house the district told us that they need to close a $20 million deficit over the next three years.
Someone at our town hall noted: In 2016 (2014?) we had almost near identical enrollment as today. And yet in the meantime, the district added just one school, yet now it seeks to close 3. What has change since 2016 that i) the district can afford 2 less schools than it could in 2016 with the same enrollment, ii) we spend more in real terms after inflation.