

More enrollment data and other revelations from Bellevue School District
2022-23 enrollment data; exchanges with the district demographer; flawed private school estimates; my subjective opinion on the district and board

It’s been awhile, and there’s a lot happening! The board will be meeting this Thursday, February 9th, and recommendations for school closures are on the agenda for 6:00 p.m.
I’ve wanted to post but have suddenly had the most bizarre sleep schedule and have had very little time at all for anything except this guy:
This is baby James, and he’s why I’m so fired up. My wife and I moved into our current house nearly two years ago with plans to start a family. It was in a perfect location for our future kids to walk to Woodridge Elementary. And now the school board is upending that plan, and without any solid data to motivate their decision.
Apologies in advance for errors, I’m operating on very limited sleep.
Executive Summary
BSD shared enrollment data from 2017-18 to 2022-23. Data for cohorts that started post-pandemic only stretches for a couple of years, but paints a picture consistent with sticky private school choices. The class that started in 2020-21 has consistently grown each year, as well as the class that started in 2021-22.
The overall district enrollment from the district’s data still shows a slowing decline, though a year later than my previous analysis on data from the state. This is due to the lack of pre-K in this dataset.
I found that BSD is estimating private school departures based on records requests from private schools. This method fails to capture students that don’t make such a request, and we don’t know what the compliance rate is. This method also fails to capture kindergarteners and first graders that attend private schools without ever enrolling in BSD.
I was able to continue my conversation with the district’s demographer. I don’t want to be uncharitable, but I think he misunderstands the American Community Survey conducted by the U.S. Census Bureau. He also seems to put forward hypotheses as explanations without testing those hypotheses.
I opine on district leadership and why they seem so reluctant to take the private school angle seriously.
More enrollment data
I was able to get 2022-23 enrollment figures from a public records request with the district. The OSPI data that I have for prior years is very divergent with the figures the district has for prior years, showing hundreds more kids in BSD than BSD has estimated. Any comparison I make is going to show massive drops as the higher OSPI figure transitions to the district figure.
Fortunately the BSD public records folks have a quick turn around, so I’ve been able to compile district data going back to the 2017-18 school year.
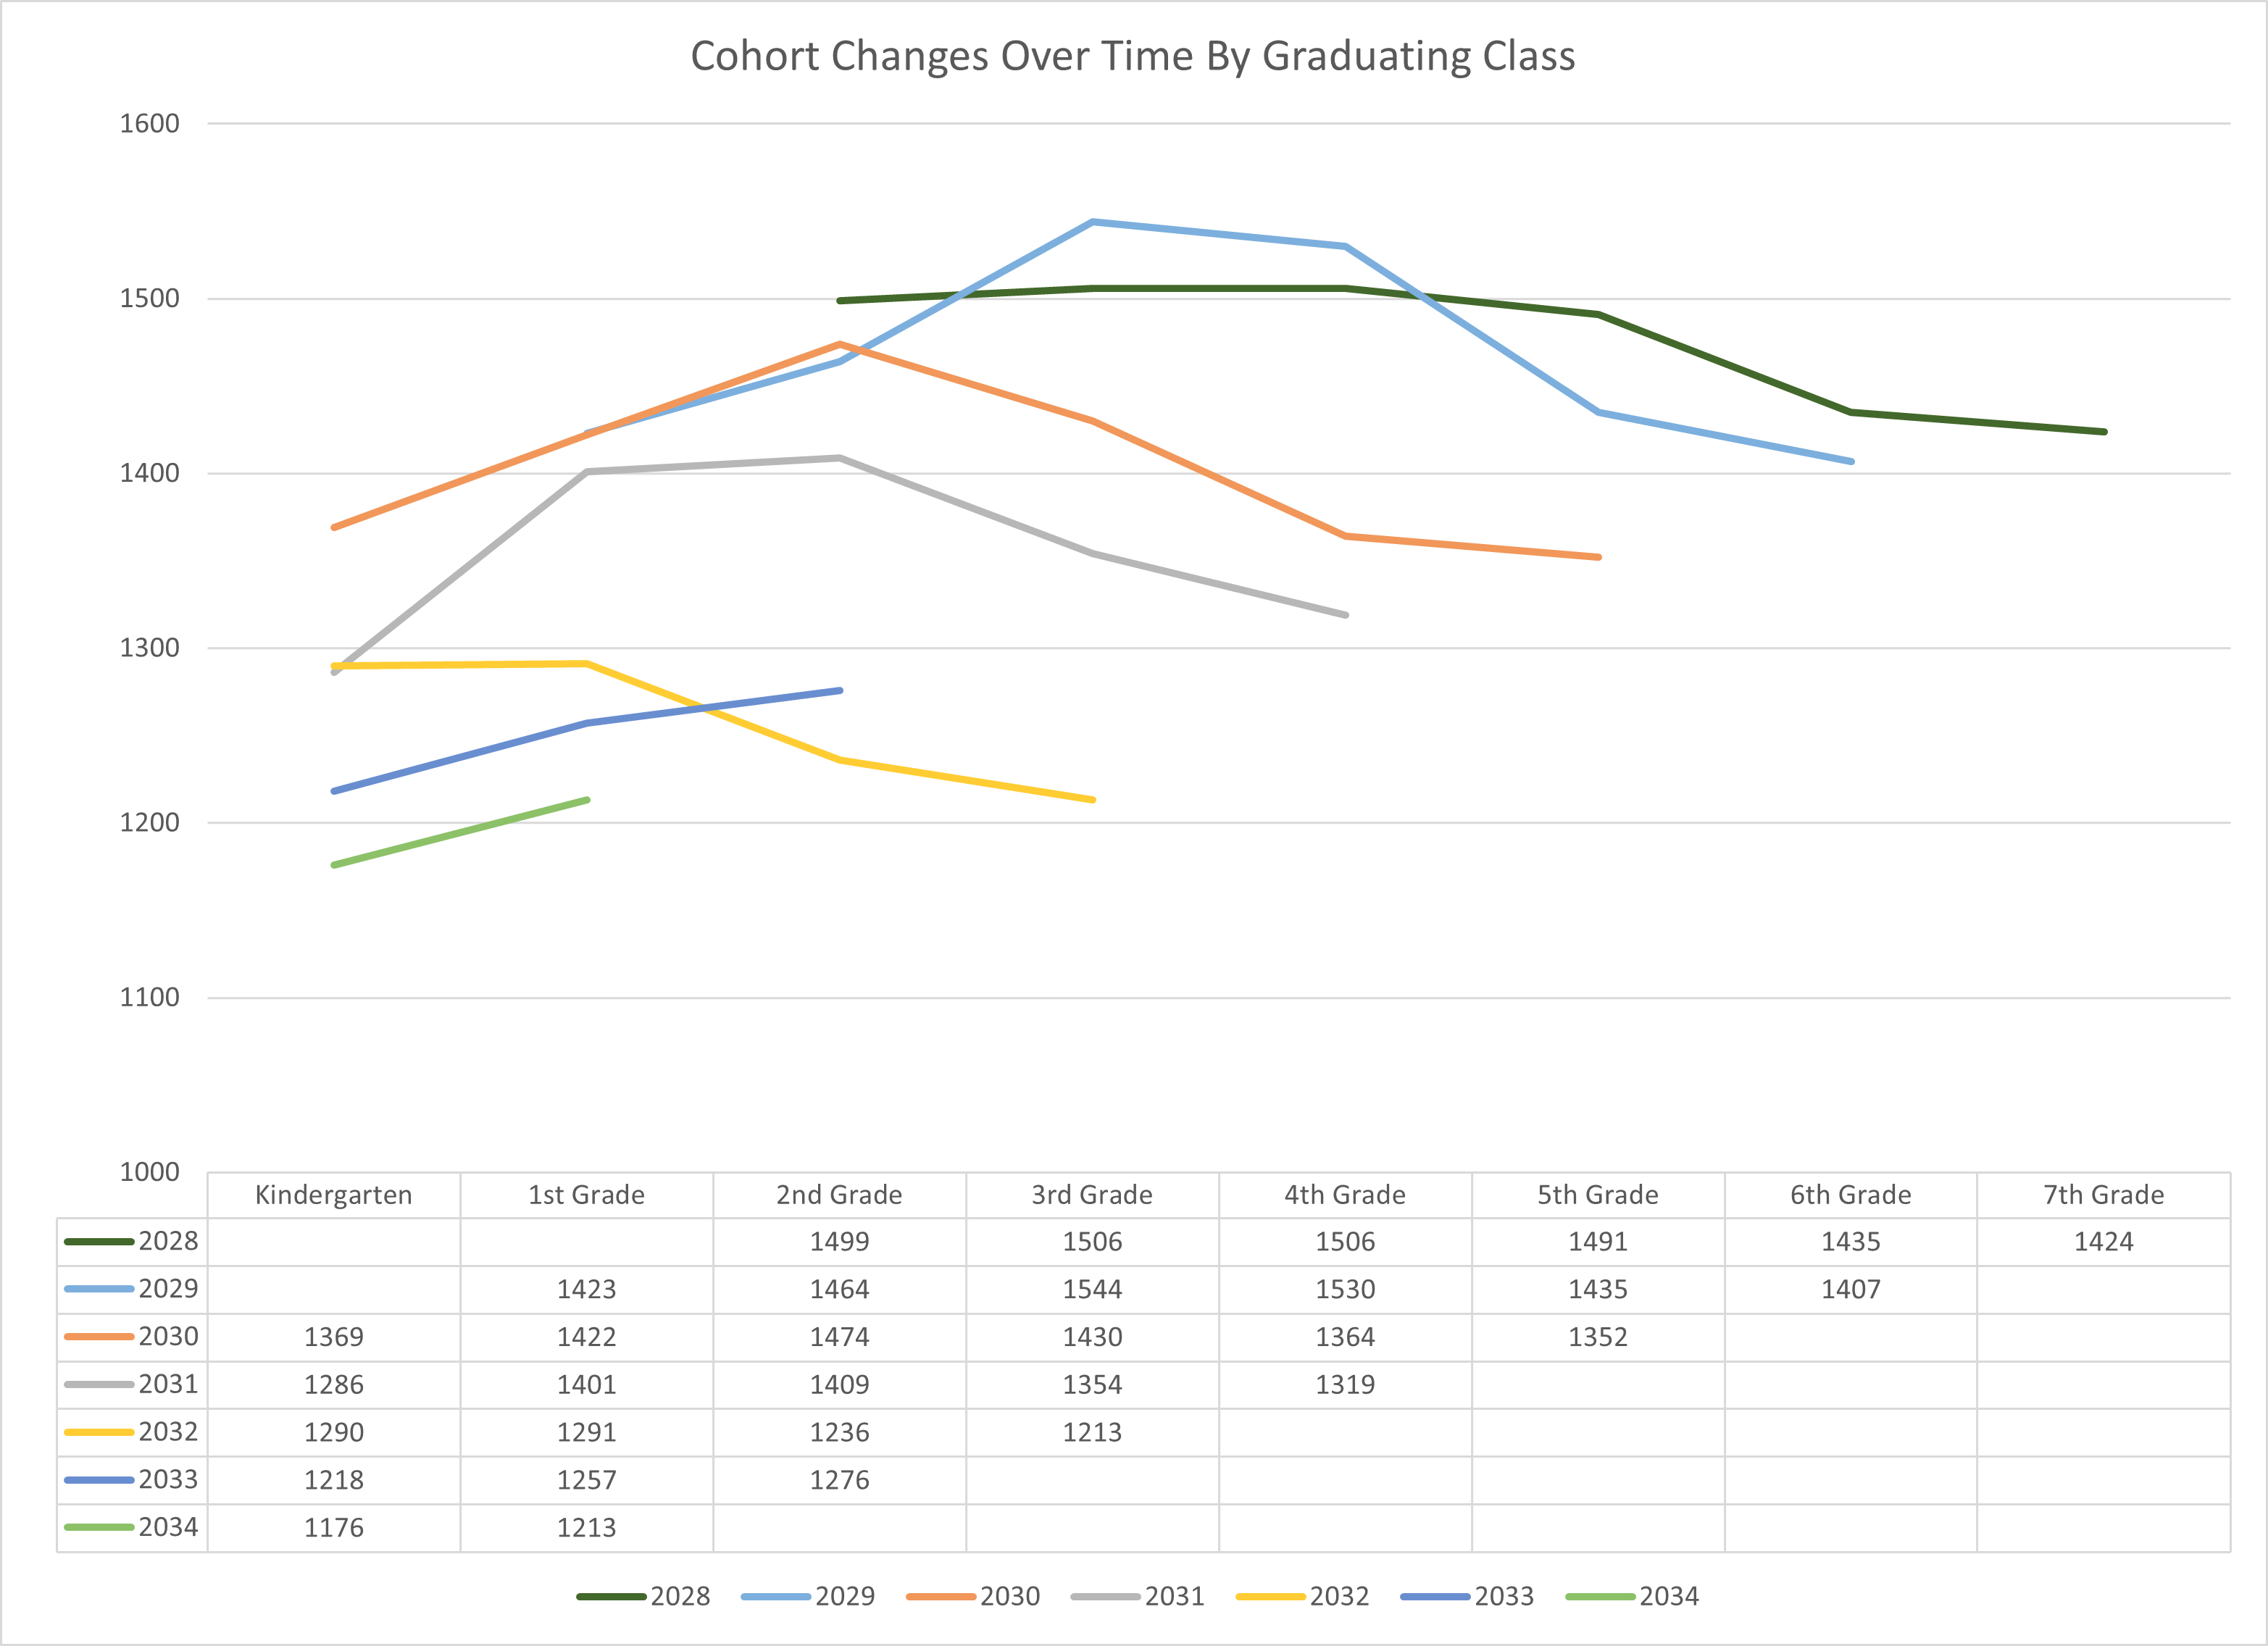
We know from past analysis that the enrollment drop was especially concentrated in earlier grades. So let’s look at the cohorts that were elementary schoolers for the 2021-22 school years and later:
My hypothesis has been that the enrollment decline has been mostly driven by parents opting out of public schools in response to district policies, largely going to private. Previous analysis estimated that for every 100 K-3 students BSD lost, private schools within BSD’s boundaries gained 85.
Those losses to private schools are going to be sticky. Parents are going to be hesitant to re-enroll in public schools. Their kids have already made new friends. They may feel that the quality of education is higher, and they may have lost trust in the school district.
However, we now have cohorts that first enrolled after the start of the pandemic. For the parents in that cohort who were considering private school, they already chose public, and that decision will also be sticky. Look at the class of 2033, which was the first class to start kindergarten after the start of the pandemic. It has consistently gained students. The only other class with more than one year of data, class of 2034, has also gained, but that is typical of the transition from kindergarten to first grade.
One point we can expect to be less sticky is in the transition from 8th to 9th grade. Most private schools in the area are K-8. This creates a natural decision point for parents on whether they want to enroll their kids in Bellevue’s highly rated high schools or continue on to a private high school.
Here’s a chart of how cohorts grew between the 8th and 9th grades each year:
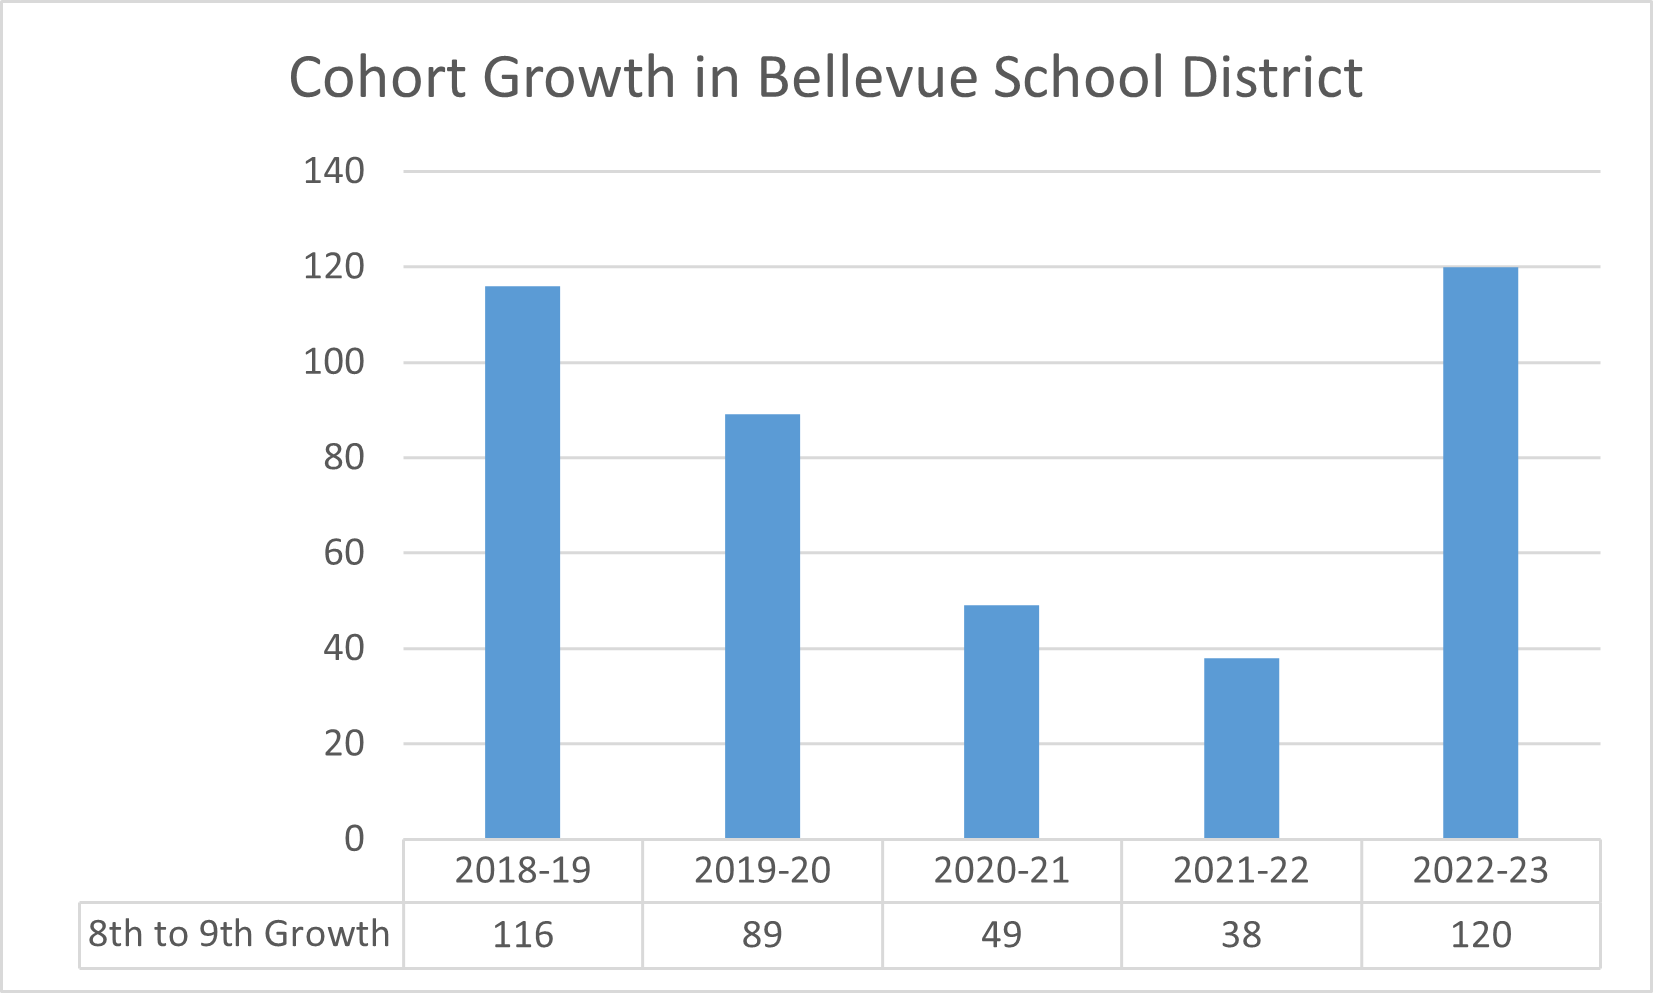
This again is consistent with the hypothesis that students are still living in the district but just not attending public schools. It’s plausible that kids went to private schools during the pandemic, then when they hit ninth grade and pandemic restrictions were lifted, they came back.
Last on this topic, let’s see if we can confirm that the trend we saw in previous analysis, that enrollment is accelerating in a positive direction, is still true. Here’s percent change in total enrollment:

This does show we’re accelerating in the right direction, but only as of this year. This is because of pre-K. In the state data I included pre-K in the total enrollment counts. The district’s data does not count these students in its total enrollment. They’re also broken out into a couple different programs whose name shifts over time, so including pre-K might be introducing noise. I’ll leave this as-is, it’s still consistent with a rebound.
This enrollment data isn’t available on the district’s website. I’ve shared the files they’ve sent me on OneDrive here.
The district’s private school estimates
When I spoke with the district at Woodridge’s open house I found that they had far lower estimates for private school growth than I had. I asked about their methods and they got back to me. I’ll just quote the response verbatim:
Our methodology used to estimate the number of students who have left our system for private schools is based on requests for records (legally required when enrolling students in WA). For the 2020-21 and 2021-22 school years it was apx. 250 and has since climbed up to apx. 400 if we include this current school year.
I tried to find the law mentioned and the closest I could find was RCW 28A.225.330. It states:
The school enrolling the student shall request the student's permanent record including records of disciplinary action, history of violent behavior or behavior listed in RCW 13.04.155, attendance, immunization records, and academic performance from the school the student previously attended.
The text surrounding this, and the chapter, seems to apply to public schools. Please comment below if you think I’m interpreting this incorrectly.
I’ve also seen at least one parent on a Facebook group report that they transferred their kid from BSD to private schools and made no such records request. I can’t find the post at the moment, but I also remember them mentioning that for earlier grades such records weren’t particularly useful.
My methods are detailed on my prior post, but in short, I’m counting enrollment growth at all private schools within the district’s boundaries. There is a drawback here in that some kids who live in the district may attend private schools outside of it, but that will be offset in part by kids who live outside the district attending private schools inside district boundaries.
Records requests will be able to capture kids who leave to attend Lakeside, but they’ll fail to capture two big categories of students:
Students whose parents never initiated a records request.
Students who never enrolled in BSD in the first place. This would include parents who looked at the state of BSD schools in 2020-21 and decided to send their kindergartener (or first grader who just completed private kindergarten) elsewhere. It would also include kids moving into district boundaries.
Maybe all the private school growth I’ve observed is largely coming from outside district boundaries, but that would be weird. Kirkland, Redmond, Issaquah, and Renton have plenty of private schools of their own.
In any case, the district should be deeply interested in knowing where the kids have gone. If they were leaving for private schools due to pandemic policies, it may be the case that we’ll recover those losses with later cohorts.
Chatting with the district’s demographer
BSD asked their demographer to review the objections raised in my first post. He responded back to me on Jan 26, and I responded back the same day. Both messages are quite long, so I won’t quote them fully here. You can read the full demographer’s response here and my response back here. The thread stops there, I haven’t received more responses.
Below I’ll quote some of the bits I object to and explain my objections. Some of these are verbatim from the above message.
We have some pretty serious fertility problems in King County. We have the
lowest rates in the State and they are trending downward. Have a look at
the graphic below which is in reverse order with 2020 moving backwards to
2014. Not a good indicator.
I agreed that it’s true that overall births are down in King County, but wondered about how to account for migration, and did some quick regressions to find that there was no correlation between county-wide births and either kindergarten or first grade enrollment. I took a deeper look at that relationship in this post:
The census data is going to be messy. The long-form data was collected in April of 2019 and is now ancient given the pace of social change and school behaviors post pandemic. The ACS data is mostly small sample set surveys and is notoriously unreliable. I’ve been a school demographer for 40 years and have worked for Bellevue for at least 10 and census data is generally secondary to what we can obtain from our own student and housing data. The census forecasting you are showing for small subsets of the total population is pre-Pandemic and is not informed by local housing cost data and social behaviors of the people who have recently moved to Bellevue.
As far as I can tell, this is not an accurate description of the American Community Survey. The ACS gets about 2 million response per year and is conducted every year. They collect data year-round in six overlapping three-month periods.
I used data through 2021, the latest year available, but omitted 2020. The Census labeled that year's results as experimental due to the pandemic's impact on data collection and advised it not be used as a comparison with other years.
Additionally, the ACS data is always presented with margins of error. The professional statisticians at the Census Bureau are aware of how representative the samples they collect are.
We have a huge housing problem in Bellevue and in five other high value districts in our area. The $500,000 housing unit exists in Bellevue, but it is a 40-year old garden apartment that has been converted to condominium use. Our average house, if you can find one or afford one with a family, is well over $1M in value approaching $2M and that has changed dramatically in the past 18 months. Please go to zillow.com or redfin.com on your phone and search in the Bellevue market for a house and see what you find.
Granted, these are the homes for sale, but many long-term residents have been surprised by the worth of homes that they have owned for decades when it comes time to sell.
Given real estate values and vacant land values in Downtown, BelRed, Overlake, Autotown, Wilburton and Factoria, all of that housing is going to be high density and very high rent. That portion of our housing stock is going the way of Vancouver, BC to a large extent and will not produce families. Have a look at what Vancouver’s housing policies did to public school enrollment there starting in the mid 90’s. Density affects cost and cost affects families. We are in that reality now.
I have worked for over 200 school districts since 1985 and I know that families want to live in single family detached homes and the yield statistics for most districts proves that. We don’t have an affordable single family housing stock in Bellevue and it is expensive to raise a family. Families are leaving in aggregate terms for elsewhere. We are really seeing that spike post pandemic as so many people are now making big changes.
I explore the relationship between home values and enrollment in my previous post. There is not a clear relationship between higher home values fertility or enrollment. I looked at the Zillow Home Value Index over time for Bellevue and found that higher home values were correlated with higher enrollment.
I’ve also looked for scholarship on this relationship, and it’s mixed.
Some papers find that while certain demographics will have fewer children in response to higher housing prices, others respond by having more children, and this effect is large enough that on net higher housing prices yield more children. This is from NBER paper House Prices and Birth Rates: The Impact of the Real Estate Market on the Decision to Have a Baby. They find that on net every $10,000 in price appreciation increases births by 0.8%.
A Zillow blog post found that higher home prices are correlated with lower fertility. They correlation is not tight, and they say that only 19% of the variation in fertility rates can be attributed to housing prices.
A paper titled “Do women delay family formation in expensive housing markets?” answered its title question with a yes, but that also overall fertility rates are not reduced.
A paper looking at this relationship in Denmark also found that higher housing prices on net are correlated with higher fertility.
My criticism of your data here is that the districts that lost enrollment in your graphics are our peers from a demographic, economic and housing cost standpoint and the others are not. The enrollment behaviors that are challenging public education now are highly segmented and these data that combine Bellevue with districts with different circumstances can’t be effectively used for macro correlations.
My aim here wasn’t to make projections for BSD, but to look at trends across districts in an effort to discover what variables may be relevant. I did find that every district except for Seattle had its enrollment accelerate in the direction of growth, either losing fewer students than the year prior or gaining students.
The greatest correlation I could find with enrollment changes wasn’t home prices, but population density.
We will not be able to recover the students that have been lost in grades K-8 for quite some time and the current larger high school grades are soon to matriculate out of our system. Bellevue is not at fault in this regard and many, many, many other districts are in the same circumstances Nationally and are trying to continue their high level of service in a new environment.
Finally, in order to return to growth, the district would have to put the elementary robustness back in the graphic above and the only way to do that is with affordable housing targeted to families. That’s not going to happen in Bellevue.
We would also have to reverse the societal trend toward fewer children and smaller families. I don’t see that happening in my lifetime.
Agreed that much of what was lost is going to be sticky, but one possibility is that kindergarten and first grade enrollment will recover and we’ll end up lower on the y-axis but the slope of the line will become positive and we’ll resume the growth trend we had before the pandemic.
See above for an exploration of the relationship between housing prices and fertility.
My completely subjective opinion of district leadership
This is a bit of a rant, and a not full formed, feel free to skip if you only care about the data.
I think the board and the district do not want to admit that their decisions were the biggest factor in enrollment decline. There’s a personal responsibility dimension to this. Politicians don’t like to admit when they make mistakes.
There’s also a political dimension.
Chris Reykdal, Washington Superintendent of Public Instruction, tweeted this just three days ago:


If you’re a partisan like Reykdal, you may be interpreting any criticism of public schools as right-coded and therefore not to be taken seriously. There’s certainly no lack of culture war fodder involving public schools. There are a lot of folks that have dug their culture war trenches long ago and don’t want to peek over the top to see what’s actually happening in the world.
With this view of the world it’s easy to put your blinders on and ignore all evidence that parents have opted out of the school district. Even if they are, you could reason that they must be Republicans. Does it matter less if we’re scaring away conservative parents and their kids?
Never mind that this is a national poll, that it shows plenty of dissatisfaction in general, and that we see revealed preference in the clear growth trends in private schools in Bellevue.
So, we have two external forces pushing our board members to not even engage with the idea that parents are opting out of schools. The only external force pushing in the other direction is the possibility that voters hold them accountable for making a mistake.
But it is not a guarantee that they’d be voted out for such a mistake. School board races in Bellevue have not been competitive in recent years. Three of the current five board members ran unopposed. The other two won in 65/35 blowouts. We don’t have an effective opposition party in this state, and definitely do not have one in Bellevue.
This board is not responsive to its voters
I’ve emailed the board many times, as well as my district’s specific board member, and have never received a response. I’ve talked to many parents and have never met one that got a person response, either.
After my first look at enrollment growth trends I emailed the boards of the top three districts to ask if they had any insight on what they were doing right. I got many responses, including one very thoughtful nearly thousand word essay on the difficulties of managing changes within school districts.
I haven’t even gotten a form letter from our board.
On risk and accommodation
Every parent in the district should be able to make use of our public schools. How you approach risk is a value judgment that isn’t the district’s place to judge. If you feel that it’s too risky to send your kids for in-person instruction, for whatever reason, the district should accommodate that. If, in fall of 2020, you judged the risk of remote learning to your child’s education to be greater than the risk of the pandemic, the district should be willing to accommodate, that too. There were teachers willing to teach in-person at that time. The private schools were open.
Public schools are for everyone. Private schools are great, too, but you shouldn’t feel like you’d be failing as a parent unless you sent your child to a private school.
> and I know that families want to live in single family detached homes and the yield statistics for most districts proves that. We don’t have an affordable single family housing stock in Bellevue and it is expensive to raise a family. Families are leaving in aggregate terms for elsewhere.
This same person said literally the opposite thing using the exact same reasoning 7 years ago in the 2015 planning report. Bonkers.
Awesome!
Re: birth rates. Nationally we are now seeing a 'COVID bump'.
Births have jumped back up to 2018 levels.
Will be curious to see if new King country data follows the trend.
https://www.ipr.northwestern.edu/documents/working-papers/2022/wp-22-43.pdf